


FitHalo Calorie Calculations
Author: Jacob Johnston, FitHalo Developer
Last Updated:
April 2026
Table of Contents
1. Introduction
FitHalo has a number of unique activity types that aren’t provided natively in watchOS or iOS. This means that Apple has not provided any built-in way to determine the amount of calories burned during the activities. FitHalo, thus, provides its own estimations. These caloric estimations are modeled, as much as possible, based on scientific literature around the specified activity.
This article is for the nerds, the scientifically minded, and the others who may be looking to replicate some of these methodologies in their own applications. In it, I provide the formulas FitHalo uses, reference to the relevant literature, and some of the data used to create the caloric expenditure models used by FitHalo.
I’m always open to adjusting these formulas as new literature becomes available. So, if you’ve noticed a big glaring flaw in my models, have some new publication I should be looking at, or want to simply suggest a feature – drop me a line from the Support section within the FitHalo app.
Disclaimer: These calorie estimates are approximations based on limited studies and modeled data. They’re intended for general guidance, not medical or metabolic diagnosis.
2. Limitations
Flaws Up Front
Let’s start with the elephant in the room: there’s a lot of extrapolation from very small data sets here. If this were ever needed for clinical application, the majority of these studies don’t come anywhere near the sample sizes or statistical power one would need just to avoid being laughed out of the room when presented for peer review or regulatory approval (and that’s before I layer on some of my tenuous assertions for fitness tracking). So - I get it - the data may be weak, but it’s better than just making it up entirely - which I’m sad to say a lot of online calorie calculators and niche fitness tracking apps appear to do. At least I’m transparent about my approach and its origins!
Now let’s talk about the other very large elephant in the room (yes, it’s a crowded room): estimating metabolic burn for activities is a flawed and messy activity even with lots of great data to model from. So, while FitHalo still attempts to do its best at estimating caloric burn, it doesn’t take much digging into scientific literature to see that, unless you personally have a mask strapped to your face to measure oxygen consumption and carbon dioxide production, you’re probably getting a flawed estimation of caloric burn.
Practical Advice: Log Food & Weight, Not Exercise
If you’re looking to get a good estimate of caloric consumption so that you can adjust your diet accordingly, there actually is a good approach you can take - the only caveat is that you need to log all of your food intake and weigh yourself frequently. With just these two pieces of information, however, it’s relatively simple math to work backwards and understand your daily caloric consumption (at least as a weekly or monthly average). My favorite app to do this right now is MacroFactor. FitHalo and its author have no affiliation with MacroFactor, but it’s an absolutely wonderful app backed by a team that appears to care deeply about applying science and research to health.
3. Exercise Types
3.1 Loaded Carriage - Weighted Vests and Rucking
3.1.1 Loaded Carriage Introduction
Weighted vest and rucking activities (collectively referred to as “loaded carriage”) have some of the better-studied caloric expenditure estimates. It turns out, militaries around the world have a whole lot of interest in understanding how many calories their soldiers are burning carrying around heavy backpacks all day (so they can, presumably, know how much they need to be feeding them).
Throughout the 1960s-1970s, the U.S. Army Research Institute of Environmental Medicine (USARIEM) conducted a number of military physiology and human performance programs. This was directly funded through the Department of Defense with the goal of providing good, quantitative models for logistics requirements about soldiers (e.g., how much food to provide? how long can marches be? how do weather and terrain impact these things?). Decades of follow-on work, much of it from the same lineage of researchers, has continued to refine the resulting equations.
FitHalo lets you choose between four metabolic models for loaded carriage activities: the original Pandolf Equation from 1977, the GoRuck Equation popularized in 2025, the modern Load Carriage Decision Aid (LCDA) family of equations, and the heart-rate-driven Keytel Equation.
3.1.2 The Pandolf Equation
One result of the USARIEM effort was a publication titled “Predicting energy expenditure with loads while standing or walking very slowly” (Pandolf et al., Journal of Applied Physiology, 1977). It provided this formula for calculating metabolic energy consumption during loaded carriage.
In this equation:
- \(M\) = metabolic rate (watts)
- \(W\) = body weight (kg)
- \(L\) = load weight (kg)
- \(\mu\) = terrain coefficient (see Table 1 below)
- \(V\) = walking speed (m/s)
- \(G\) = grade/incline percent (e.g., 5% would be 5.0)
Pandolf was derived only for level and uphill walking. The equation has no defensible behavior at negative grades, and feeding it one can produce values that drift away from reality. In FitHalo, the Pandolf and GoRuck equations both clamp \(G\) to a non-negative range, treating any descent as flat ground for the purposes of caloric estimation. (LCDA, described below, doesn’t have this limitation.)
| Terrain Type | Coefficient |
|---|---|
| Pavement | 1.0 |
| Trail | 1.2 |
| Slippery | 1.7 |
| Sand | 2.0 |
| Snow | 3.0 |
| Swamp | 3.5 |
3.1.3 The GoRuck Equation
In early 2025, GoRuck (a company that produces great rucking gear - again, no affiliation with FitHalo) updated their website with a new calorie estimation calculator and provided conjecture that more-recent scientific literature supported a generally-higher caloric burn rate when rucking. They made reference to, in particular, a paper that was bluntly titled “The Pandolf equation under-predicts the metabolic rate of contemporary military load carriage” (Drain et al., Journal of Science and Medicine in Sport, 2017), which appeared to demonstrate an error rate of 12-33% in the original Pandolf Equation. GoRuck published a modified equation, using the same variables as the Pandolf Equation, that compensates for this error:
The GoRuck equation produces noticeably higher caloric estimates than Pandolf at moderate loads and speeds. Like its predecessor, however, it will provide the same caloric estimates for downhill versus flat grades.
3.1.4 The Load Carriage Decision Aid (LCDA)
Both Pandolf and GoRuck have a deeper limitation: they treat all carried load identically. A 20 kg backpack and a 20 kg weighted vest produce the same answer, even though the empirical metabolic costs differ between the two placements. Pandolf was, again, also a level-and-uphill model; downhill physiology simply isn’t represented in either equation.
Over the past decade, the same USARIEM lineage that produced Pandolf has been incrementally rebuilding the model from first principles. The new family is the Load Carriage Decision Aid (LCDA), and FitHalo synthesizes its loaded carriage estimates from three constituent papers by Looney and colleagues:
- “Estimating Energy Expenditure during Level, Uphill, and Downhill Walking” (Looney et al., Medicine & Science in Sports & Exercise, 2019) introduced a continuous graded walking term that’s well-behaved across the whole range of walkable terrain (roughly -40% to +45%).
- “Modeling the Metabolic Costs of Heavy Military Backpacking” (Looney et al., Medicine & Science in Sports & Exercise, 2022) added the backpack load term, validated up to 66% of body mass.
- “Metabolic Costs of Walking with Weighted Vests” (Looney et al., Medicine & Science in Sports & Exercise, 2024) added the weighted vest term and presented the unified model FitHalo uses today.
Following the modular structure of the 2024 paper, the metabolic rate is composed from a few pieces:
with the downhill switching function
and a fixed net standing cost \(M_{\text{Stand}} = 0.21\,\text{W/kg}\).
In these equations:
- \(M\) = total metabolic rate (watts)
- \(M_{\text{Rest}}\) = resting metabolic rate (watts)
- \(M_{\text{Stand}}\) = net standing metabolic rate, fixed at 0.21 W/kg
- \(M_{\text{Walk}}\) = net walking metabolic rate (W/kg)
- \(W\) = body weight (kg)
- \(\mu\) = terrain coefficient (see Table 1)
- \(V\) = walking speed (m/s)
- \(G\) = grade/incline percent, clamped to \([-40, +45]\)
- \(L_b\) = backpack mass divided by body mass (dimensionless)
- \(L_v\) = weighted vest mass divided by body mass (dimensionless)
- \(\phi(G)\) = downhill switching function
A few notes on how this gets applied in practice:
- Pack vs. vest is workout-driven. The LCDA model itself supports a non-zero \(L_b\) and \(L_v\) at the same time, but FitHalo’s UI presents them as either/or based on the workout type you log: a Ruck workout passes your pack mass with vest mass set to zero, and a Weighted Vest workout passes your vest mass with pack mass set to zero.
- The downhill switching function does the heavy lifting. At positive grades (uphill), \(\phi(G)\) is essentially 1.0 and the \(0.34\,V G\) term becomes a positive uphill cost. At negative grades (downhill), \(\phi(G)\) transitions toward 0 and then to negative values, capturing the “J-shaped” relationship that Margaria first described in the 1930s: gentle descents reduce energy cost, while very steep descents increase it again because of braking forces and eccentric muscle action.
- The published LCDA equations express grade as a decimal (rise/run). For consistency with the Pandolf and GoRuck equations on this page, the equations above are written with \(G\) as a percentage and the grade-related coefficients have been rescaled accordingly. The two forms are mathematically identical.
3.1.5 The Keytel Equation
All three of the equations above are mechanical models. They care about your weight, your load, and your speed, but they have no idea whether you’re cruising or struggling. As a fourth option, FitHalo lets you pick the Keytel formula for loaded carriage workouts. Because Keytel is heart-rate driven, it implicitly captures things mechanical models miss such as heat, fatigue, cardiovascular conditioning, even altitude – all at the cost of completely ignoring how much load you’re carrying.
The Keytel formula and its sex-specific regressions are described in detail in 3.2 Sauna, where it does most of the work for FitHalo’s sauna calorie estimates. For loaded carriage, it’s best treated as a cross-check rather than a replacement: if your Keytel estimate and your LCDA estimate land in the same neighborhood, you can have higher confidence in the number. If they diverge sharply, usually with Keytel running noticeably higher, that’s a hint that something other than pure mechanical work (heat, exertion, fatigue) is contributing to the burn.
3.1.6 Putting it All Together
Because Pandolf, GoRuck, and LCDA all share the same primary inputs (weight, load, speed, grade, terrain), it’s easy to compare them side by side. The two charts below show caloric burn rate as a function of incline at a fixed pack and pace, and as a function of pack weight at a fixed pace and incline.
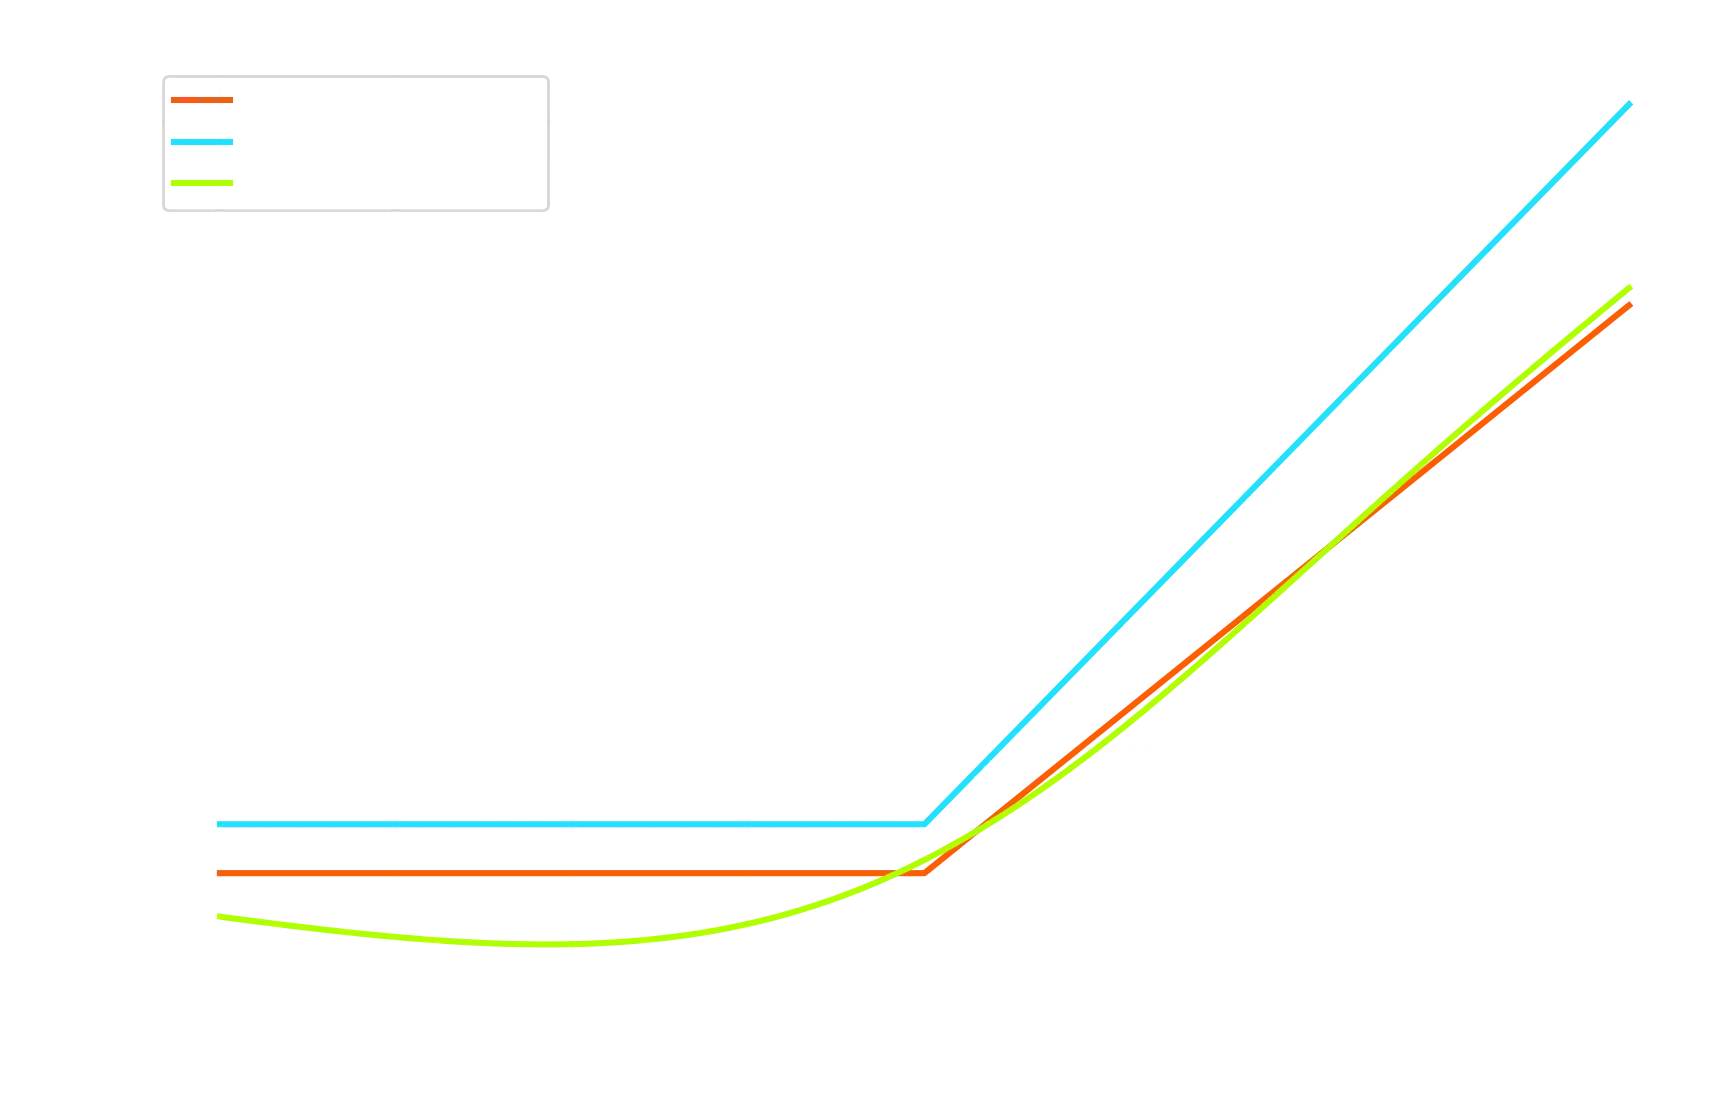
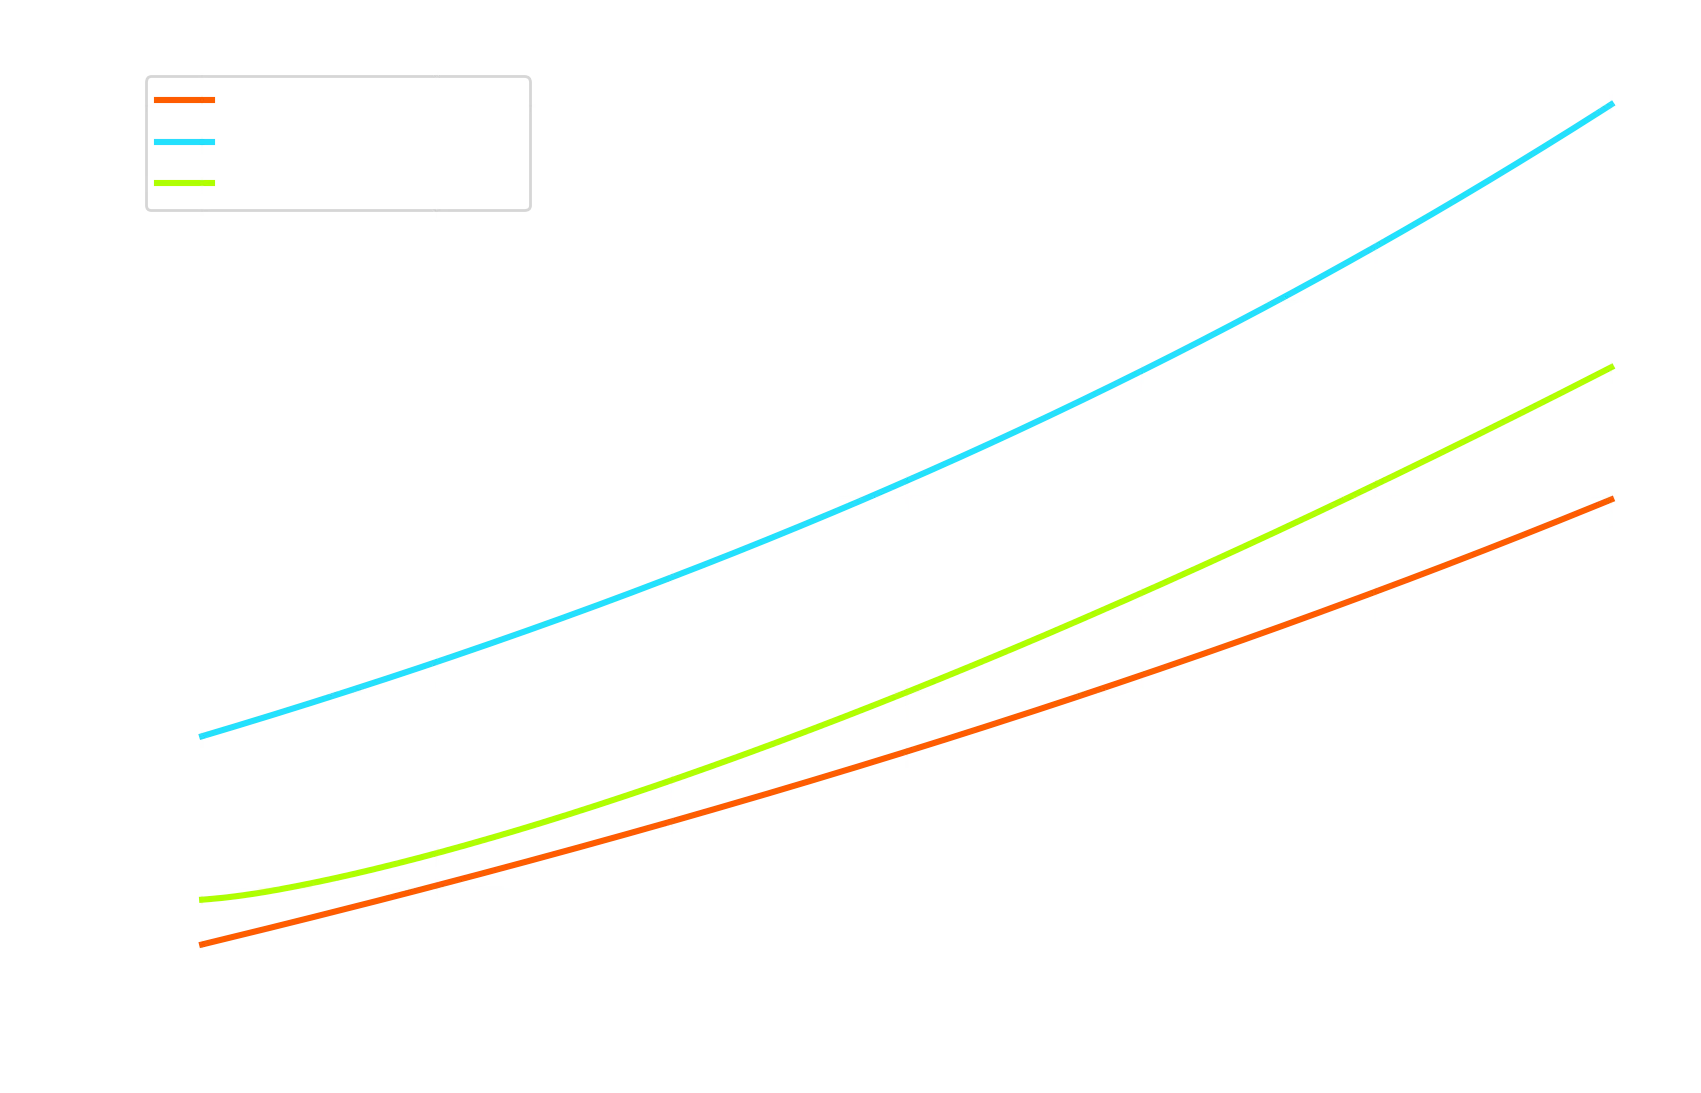
By default, FitHalo uses LCDA. It’s the most recently validated of the four models, has the broadest published support, and is the only mode designed for the full range of downhill grades. Pandolf and GoRuck remain available for users who want continuity with historical numbers, and Keytel is there for users who want to lean on heart-rate data for cross-checking.
One implementation detail that applies to all four models: FitHalo pulls your resting metabolic rate from your Apple Health Basal Energy, which iOS computes from your demographics and health history rather than something FitHalo directly estimates. After computing the workout’s total metabolic cost from whichever equation you’ve picked, FitHalo subtracts your basal energy share for the workout’s duration to report the active energy burned.
3.2 Sauna
I have yet to find any big military-funded studies on caloric consumption in the sauna. I guess no big world superpowers get there by having their soldiers spend time relaxing in a sauna all day. What we do have, however, is a nice 2019 paper titled “Correlations between Repeated Use of Dry Sauna for 4 x 10 Minutes, Physiological Parameters, Anthropometric Features, and Body Composition in Young Sedentary and Overweight Men: Health Implications” (Podstawski et al., BioMed Research International, 2019).
In this study, forty-five participants were exposed to a series of four repeated sauna sessions, strapped to the usual array of masks and equipment to measure their metabolic activity. As sauna exposure time went on, heart rate increased, and so did their caloric burn – dramatically. By the last sauna session, the mean caloric consumption was a whopping 10.4 times that of their mean basal metabolic rate. This seems surprising, except that you also observe the participants’ heart rates went as high as 168, and only as low as 135 during this last sauna session. Their hearts were working hard.
It’s not a huge logical leap to reason that the cause for the increased energy expenditure is the amount of extra cardiovascular work that starts to happen. That, in turn, also raises the question of whether we can use standard models for estimating the relationship between heart rate and calorie burn. The paper titled “Prediction of energy expenditure from heart rate monitoring during submaximal exercise” (Keytel et al., Journal of Sports Sciences, 2005) provides a set of regression formulas for that exact estimation and needs only heart rate, sex, age, and weight. This study has actually been used as the basis for caloric consumption estimates by a wide variety of fitness wearables - especially for activities when motion data is unavailable. The regressions are separated for men and women as the following:
In these equations:
- \(M\) = metabolic rate (kcal/min)
- \(W\) = body weight (kg)
- \(HR\) = heart rate (bpm)
- \(A\) = age (years)
Since we have the mean heart rate and age data from the Podstawski et al. sauna study, we can do a head-to-head comparison between the actual observed caloric consumption versus what would have been predicted by following the Keytel et al. model.
| Heart Rate (Mean) | Podstawski et al. (2019), Sauna Study (kcal/10-min) | Keytel et al. (2005) (kcal/10-min) Formula | Percent Difference |
|---|---|---|---|
| 98.00 | 73.04 | 66.89 | -8.41% |
| 109.67 | 93.82 | 84.48 | -9.95% |
| 121.36 | 114.91 | 102.11 | -11.14% |
| 133.36 | 131.40 | 120.21 | -8.52% |
When mapped against the data of the 4x10 sauna study, the results came out pretty perfectly. Mean caloric consumption in the sauna study at all data points was between 8.41% and 11.14% of the Keytel study for the mean weight (85.86 kg) and age (20.76 years) of the all-male participants. Note that the sauna study consumption was always slightly higher than the Keytel regression would have predicted.
So - what does FitHalo do? Well, it just uses the Keytel formula with a 10% increase in caloric consumption to account for the differences observed in direct sauna studies:
| Heart Rate (Mean) | Podstawski et al. (2019), Sauna Study (kcal/10-min) | FitHalo Formula | Percent Difference |
|---|---|---|---|
| 98.00 | 73.04 | 73.59 | +0.75% |
| 109.67 | 93.82 | 92.95 | -0.93% |
| 121.36 | 114.91 | 112.35 | -2.28% |
| 133.36 | 131.40 | 132.25 | +0.65% |
As you can see, this maps really well – at least for the small, male-only data set that is available to us. Hopefully some university somewhere, soon, will replicate or expand upon this experiment with a more diverse set of demographics as I would love FitHalo to be able to validate (or refine) its formula against a second data set.
3.3 Cold Plunge
Creating a model for cold plunge has been a bit more challenging than other activity types because cold plunge does not appear to have the same correlation to elevated heart rate as sauna or movement-based activities. Yet, there does seem to be an elevation in metabolic rate when measuring VO₂.
The most direct study I have seen showing the metabolic effects of immersion is titled “Human physiological responses to immersion into water of different temperatures” (Srámek et al., European Journal of Applied Physiology, 2000). In this study, 10 participants were recorded in 1-hour immersions of water at various temperatures, in a random order, with a week between sessions. The water temperatures were 32 °C (89.6 °F), 20 °C (68 °F), and 14°C (57.2°F). The results showed modest changes in heart rate, but significant changes in VO₂.
| Water Temperature | Δ Metabolic Rate | Δ Heart Rate |
|---|---|---|
| 32 °C / 89.6 °F | Similar | -9 BPM |
| 20 °C / 68 °F | +93% VO₂ | Similar |
| 14 °C / 57.2 °F | +350% VO₂ | +3 BPM |
The publication then goes on to describe lots of really interesting things about how/why our bodies behave the way they do when exposed to different water temperatures (including measures of temperature, blood pressure, and some notable hormone changes). It’s definitely worth a read if you’re into cold plunge! The results are all interesting, but they DO create a fitness tracking conundrum. Often, we rely heavily on heart rate measurements for caloric estimates (e.g., the Keytel formulas), but this doesn't work well here.
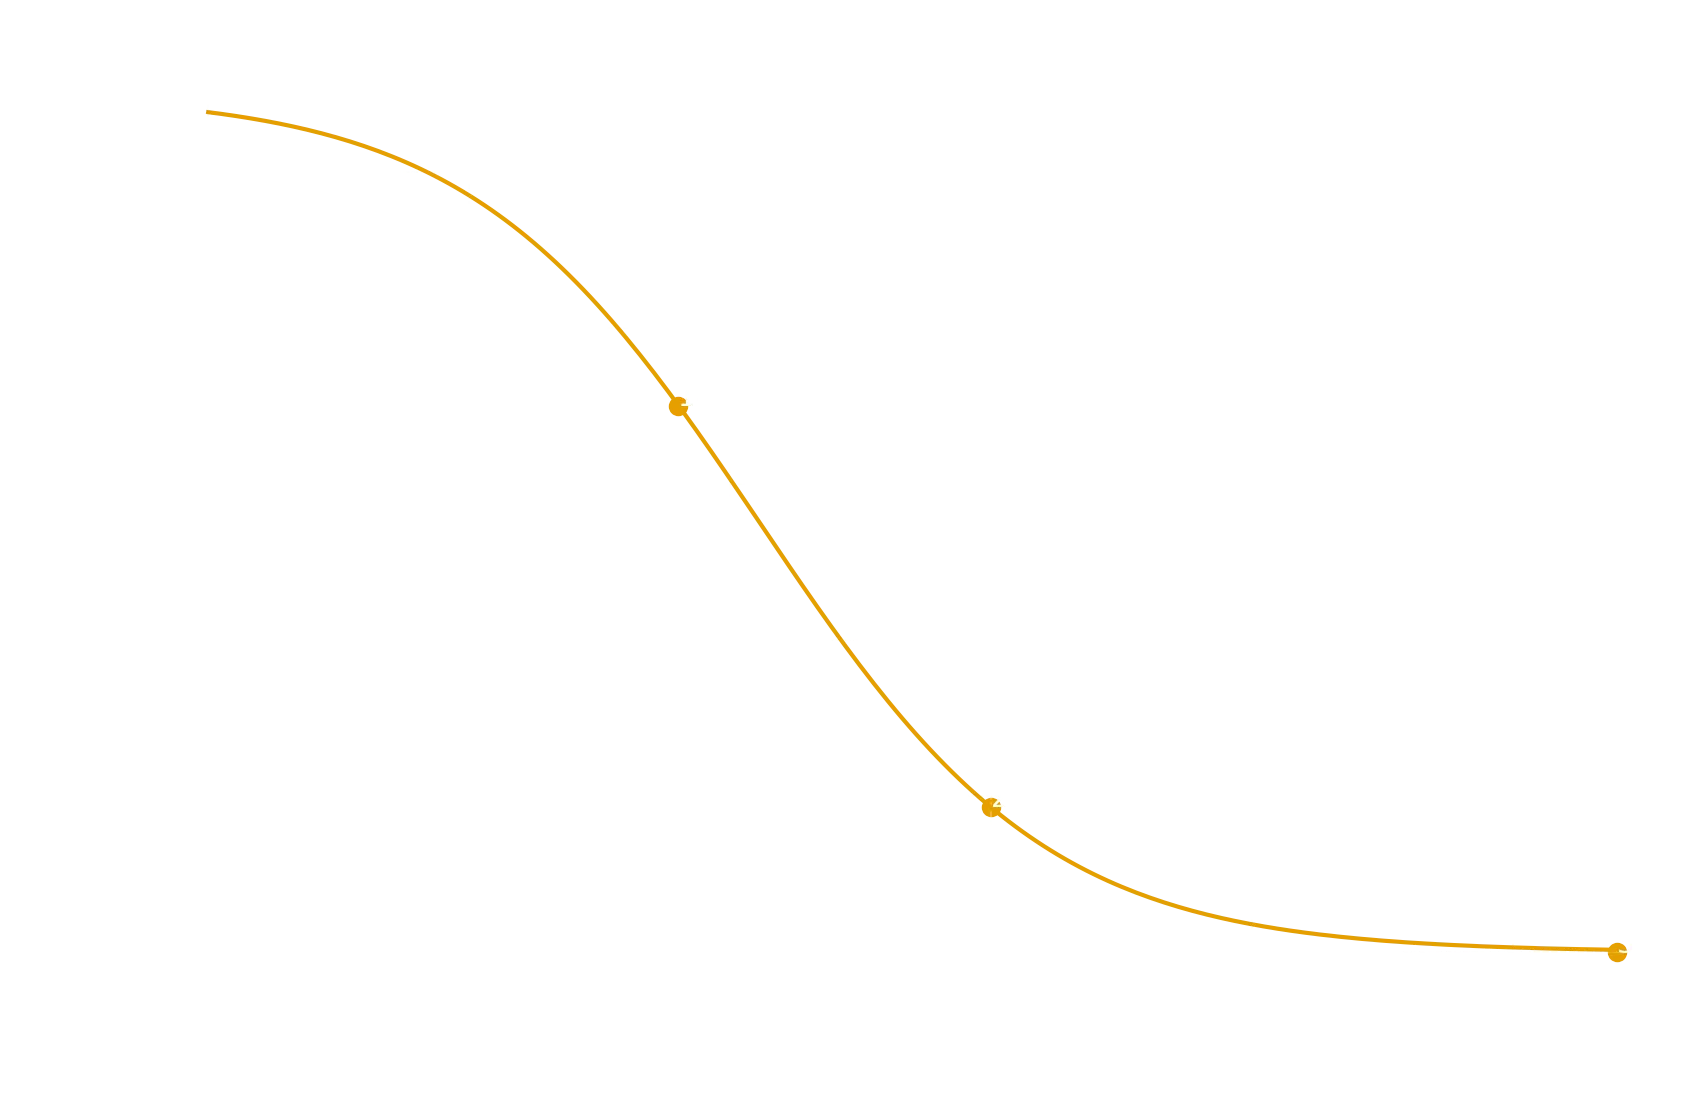
So - where does that leave FitHalo? In absence of direct biometric data that FitHalo can use to map to metabolic consumption for cold plunge, it instead uses the cold plunge temperature the user specifies. Temperature is converted to a multiplier for base metabolic rate (extrapolated from the multiplier that applied to VO₂ in the data set). Fitting the logarithmic nature of this curve to the data we have available, while also not allowing a runaway caloric multiplier for even colder temperatures, we get a curve using the following formula:
In this equation:
- \(M(T)\) = metabolic rate for a temperature
- \(M_{\text{BMR}}\) = basal metabolic rate
- \(T\) = temperature (degrees Celsius)
Any power units for metabolic rate may be used so long as \(M(T)\) and \(M_{\text{BMR}}\) match. This formula produces the following metabolic rate mapping.
| Water Temperature | Δ Metabolic Rate |
|---|---|
| 32 °C / 89.6 °F | +1% |
| 30 °C / 86 °F | +3% |
| 25 °C / 77 °F | +17% |
| 20 °C / 68 °F | +93% |
| 15 °C / 59 °F | +303% |
| 10 °C / 50 °F | +484% |
| 5 °C / 41 °F | +538% |
3.4 Stroller Walks & Runs
There have been a handful of studies that provide data on the metabolic costs for pushing a stroller around. FitHalo bases its model on data from two papers.
Study 1: Stroller Weights Compared
The first study, described in the publication “Physiologic Responses to Running with a Jogging Stroller” (Gregory et al., International Journal of Sports Medicine, 2012), had participants run without a stroller, with a jogging stroller loaded to 25 lbs (11.36 kg), and with a jogging stroller loaded to 50 lbs (22.72 kg). Some trials were done on an indoor track, and others were done on an outdoor greenway. Trials were also split between self-paced versus a controlled pace. All tests were done with strollers specifically designed for jogging (i.e., the kind that offer minimal resistance during exercise).
On a flat, smooth indoor track - strollers of either weight did not seem to significantly alter VO₂ or heart rate. The trials on the less-flat and less-smooth greenway, however, showed increased VO₂ consumption with higher perceived exertion levels from participants (though, interestingly, heart rate remained largely unchanged - I speculate because participants were likely already near max heart rates).
Study 2: Strollers on an Incline
The second study, described in the publication “Energetic Cost and Kinematics of Pushing a Stroller on Flat and Uphill Terrain” (Sandbakk et al., Frontiers in Physiology, 2020), specifically looked at the metabolic costs associated with walking and running on different incline levels (1% grade vs 10% grade) with, and without, a stroller. Participants were placed on a big ol’ treadmill and asked to push at various paces (from brisk walking to pretty intense running).
The results are what most people would expect (and also mostly in line with the Gregory et al. study). The difference between stroller and no stroller was minimal on a flat surface and much more profound on an incline.
Putting it Together
So, with these two studies providing some useful data, let’s try to model how FitHalo should be handling caloric consumption. As a starting point, I always like to see how the Keytel formula (described above) would predict energy expenditure and compare it to the actual empirical data from the studies.
First, we convert the VO₂ reported in the studies (mL·kg−1·min−1) to kilocalories per minute (i.e., what the Keytel formula reports) using:
Both studies provided mean ages and body masses of participants, but did not divide their data sets between men and women. Since the Keytel formulas are split between men and women, each of these conversions was done using both formulas and then weighted based on the makeup of their respective studies. Gregory et al. was 60% women and 40% men, and Sandbakk et al. was 53% women and 47% men.
| Trial | Heart Rate (Mean) | VO₂ -> kcal/min | Keytel Estimate (kcal/min) | Δ (%) VO₂ vs Keytel |
|---|---|---|---|---|
| Indoor Track (Controlled Pace) | ||||
| No stroller | 148 | 10.6 | 10.1 | -5% |
| 25 lb stroller | 149 | 10.6 | 10.2 | -4% |
| 50 lb stroller | 154 | 10.6 | 10.6 | 0% |
| Indoor Track (Self-Paced) | ||||
| No stroller | 163 | 12.2 | 11.7 | -4% |
| 25 lb stroller | 166 | 12.7 | 12.1 | -5% |
| 50 lb stroller | 166 | 12.5 | 12.1 | -3% |
| Outdoor Greenway (Controlled Pace) | ||||
| No stroller | 160 | 14.1 | 13.8 | -2% |
| 25 lb stroller | 164 | 15.1 | 14.4 | -5% |
| 50 lb stroller | 164 | 15.1 | 14.4 | -5% |
| Outdoor Greenway (Self-Paced) | ||||
| No stroller | 168 | 15.4 | 14.7 | -5% |
| 25 lb stroller | 170 | 16.3 | 15.1 | -7% |
| 50 lb stroller | 172 | 16.8 | 15.5 | -8% |
| Trial | Heart Rate (Mean) | VO₂ -> kcal/min | Keytel Estimate (kcal/min) | Δ (%) VO₂ vs Keytel |
|---|---|---|---|---|
| Flat (1% Incline) - Walking (6 km/h) | ||||
| No stroller | 103 | 6.0 | 5.8 | -3% |
| 24 kg stroller | 106 | 6.4 | 6.0 | -6% |
| Flat (1% Incline) - Medium Run (8-9 km/h) | ||||
| No stroller | 132 | 11.0 | 10.3 | -6% |
| 24 kg stroller | 140 | 11.9 | 11.1 | -7% |
| Flat (1% Incline) - Fast Run (11-12 km/h) | ||||
| No stroller | 157 | 14.3 | 13.5 | -6% |
| 24 kg stroller | 164 | 15.4 | 14.5 | -6% |
| Uphill (10% Incline) - Walking (5 km/h) | ||||
| No stroller | 119 | 9.1 | 8.6 | -5% |
| 24 kg stroller | 132 | 11.2 | 9.9 | -12% |
| Uphill (10% Incline) - Medium Run (6.5-7.5 km/h) | ||||
| No stroller | 150 | 14.4 | 13.2 | -8% |
| 24 kg stroller | 168 | 17.3 | 15.5 | -10% |
| Uphill (10% Incline) - Fast Run (7.5-8.5 km/h) | ||||
| No stroller | 163 | 16.2 | 14.3 | -12% |
| 24 kg stroller | 180 | 19.2 | 16.8 | -13% |
Taking a look at this data, a few things are notable:
- The Keytel formula actually does a commendable job all by itself, never being more than 13% off from the empirical data. FitHalo could probably use the Keytel formula alone and be accurate enough for most people’s tastes.
-
Introducing incline or challenging surfaces causes the Keytel formula to drift off. There are a few plausible reasons why this might be
happening:
- The linear relationship between heart rate and VO₂ works at sub-maximal heart rates, and the average heart rates of participants reached near-maximal levels in the more-intense trials.
- Keytel was modeled on steady-state exercise types. The greenway terrain, in particular, could have had varied intensities in traversal.
However, we do have another model that incorporates an added term for incline: the formulas we use for loaded carriage - Pandolf Equation and the GoRuck equation. So, as an experiment, I just added that term to the Keytel equation (and adjusted the multiplier to convert from watts to kcal/min) and de-emphasized the value of weight - after all - pushing a stroller is a lot easier from carrying its full weight on your back. Yeah, I know, this is a "creative" (read: admittedly scientifically and mathematically invalid) method fitted to a very specific data set, but it will be the heuristic FitHalo uses until a more validatable source comes through.
Thus, FitHalo’s formula ends up being:
In this equation:
- \(M_\text{Keytel}\) = the metabolic rate predicted by the Keytel formula (kcal/min)
- \(W\) = body weight (kg)
- \(L\) = weight of the stroller and its contents (kg)
When this formula is used against the empirical data from the Sandbakk et al. study - we get:
| Trial | Heart Rate (Mean) | VO₂ -> kcal/min | FitHalo Estimate (kcal/min) | Δ (%) VO₂ vs FitHalo |
|---|---|---|---|---|
| Flat (1% Incline) - Walking (6 km/h) | ||||
| No stroller | 103 | 6.0 | 5.9 | -2% |
| 24 kg stroller | 106 | 6.4 | 6.1 | -5% |
| Flat (1% Incline) - Medium Run (8-9 km/h) | ||||
| No stroller | 132 | 11.0 | 10.4 | -5% |
| 24 kg stroller | 140 | 11.9 | 11.2 | -6% |
| Flat (1% Incline) - Fast Run (11-12 km/h) | ||||
| No stroller | 157 | 14.3 | 13.6 | -5% |
| 24 kg stroller | 164 | 15.4 | 14.6 | -5% |
| Uphill (10% Incline) - Walking (5 km/h) | ||||
| No stroller | 119 | 9.1 | 9.6 | +5% |
| 24 kg stroller | 132 | 11.2 | 11.2 | 0% |
| Uphill (10% Incline) - Medium Run (6.5-7.5 km/h) | ||||
| No stroller | 150 | 14.4 | 14.2 | -1% |
| 24 kg stroller | 168 | 17.3 | 16.8 | -3% |
| Uphill (10% Incline) - Fast Run (7.5-8.5 km/h) | ||||
| No stroller | 163 | 16.2 | 15.3 | -6% |
| 24 kg stroller | 180 | 19.2 | 18.1 | -6% |

This gave FitHalo a closer match on every point (and bonus calories for users doing those steep hill-climb workouts).
Update, January 2026: FitHalo 1.10 now gives the Grade term a minimum value of 0% just like it does with Loaded Carriage type workouts.
3.5 Walking Pads
Walking pads pose a specific tracking problem. Apple's built-in workout algorithms appear to lean heavily on wrist motion to gauge walking effort, but walking pad users typically have hands on a keyboard or holding a book. The wrist barely moves, and calorie estimates from the watch come out noticeably low.
Walking pads usually have a sustained, low-intensity, and multi-task use case. People don't typically walk at 1.6 m/s on a walking pad. They walk at 0.5 to 1.2 m/s for an hour or two while doing something else. Pure heart-rate-based estimates can overshoot in this regime, since a long, steady, mildly elevated heart rate accumulates into a big calorie figure even though the actual mechanical work is modest. Pure motion-based estimates undershoot, because there's no arm swing. Either signal taken alone leads you astray.
FitHalo's approach is to combine the two. For a walking pad workout, FitHalo computes an estimate two ways and then averages them:
- A mechanical estimate using the LCDA equations from the Loaded Carriage section, with pack and vest mass set to zero and terrain set to pavement. This reduces the LCDA expression to its level/uphill/downhill walking term. The load multiplier collapses to 1, the terrain coefficient collapses to 1, and what remains is just a function of body weight, walking speed, and grade. It captures the real mechanical work of putting one foot in front of the other.
- A cardiovascular estimate using the Keytel formula from the Sauna section. Keytel is heart-rate driven and captures the cardiovascular cost of sustained low-intensity effort regardless of how much arm motion is or isn't happening.
In this equation:
- \(M_{\text{LCDA}}\) = the metabolic rate from the LCDA equation with no pack, no vest, on pavement (i.e., unloaded level/graded walking)
- \(M_{\text{Keytel}}\) = the metabolic rate from the Keytel heart-rate regression
If FitHalo doesn't have a usable heart rate measurement for the workout, for example because the user wasn't wearing their Apple Watch, the Keytel half of the average isn't available and FitHalo falls back to the LCDA estimate alone. This is also what happens for the very first few seconds of a workout, before heart rate has registered.
A note on grade: many walking pads are flat-only, but a growing number of models support manual incline. Where the user has provided a grade for the workout, it flows through to the LCDA half of the calculation and contributes appropriately. Because LCDA's grade term is well-behaved across the whole range from -40% to +45%, this works for the (less common) walking pads that support a slight decline as well.
4. Closing Thoughts
Again, I want to acknowledge the premise that I very likely overfitted some of these models to very limited data sets. Yet, I also want to emphasize that this should still perform significantly better than most online calculators out there, as well as simply choosing to log an “Other” workout type on the Apple Watch. Likewise, none of FitHalo’s custom workout types will be using the Walk, Run, or Hike underlying workout types that make an outright assumption you are not carrying or pushing any sort of load (at the time of this writing) - and have the consequence of really punishing your Cardio Fitness score in Apple Health.
If you see some smart ways I could improve these even further, find new studies, or just have something you want to share with me - please reach out to me.